 https://gzambotti.github.io/housing/
Wednesday, September 21, 2016
Buffer clip using ESRI JS Geometry Engine
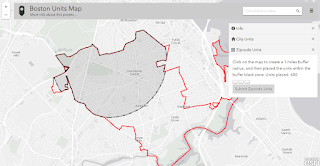
Today I have almost finished coding a mapping application using ArcGIS JS 3.17. You can try it (http://maps.cga.harvard.edu/housing/). Very interesting it was the use of the ESRI geometry engine (https://developers.arcgis.com/javascript/3/jsapi/esri.geometry.geometryengine-amd.html). Below it a screen shot of a buffer (black area) clipped by a polygon (red line).https://gzambotti.github.io/housing/
https://gzambotti.github.io/housing/
Friday, August 7, 2015
Visualizing Human Migration through Space and Time
Article about crossroadofmigration app
http://www.isprs-ann-photogramm-remote-sens-spatial-inf-sci.net/II-4-W2/155/2015/isprsannals-II-4-W2-155-2015.pdf
http://www.isprs-ann-photogramm-remote-sens-spatial-inf-sci.net/II-4-W2/155/2015/isprsannals-II-4-W2-155-2015.pdf
Friday, January 23, 2015
From WorldMap Warper to AGOL
WorldMap Warper as well as NYPL Map Warper are great tools to georeference a map online. Tonight I spent a bit of time try to load a rectified map to AGOL. This is the map in AGOL.
Here the trick:
1) Get the WM Warper URL (http://warp.worldmap.harvard.edu/maps/tile/31/z/x/y.png)
2) Change the last z,x,y to {level}{col}{row} [http://warp.worldmap.harvard.edu/maps/tile/31/{level}/{col}/{row}.png]
3) Load it as Tile Service (http://blogs.esri.com/esri/arcgis/2013/03/21/adding-tile-layers-to-your-web-map/)
Wednesday, December 3, 2014
Node JS + Express + PostGIS + Leaflet - Second round
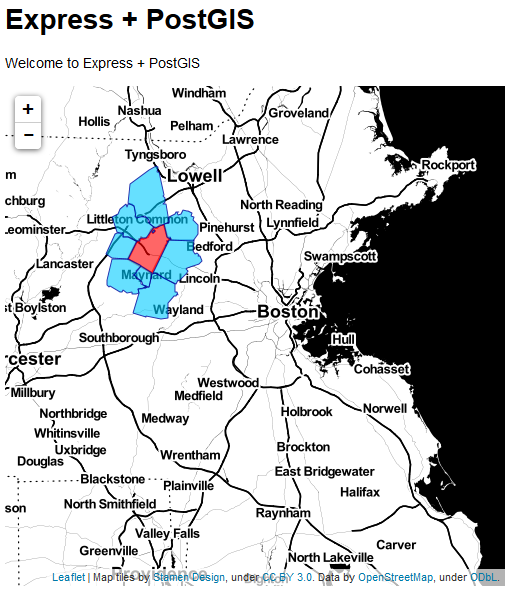 Ok, I am getting serious now! I was able to replicate what I have been done using cartodb and leaflet (https://github.com/gzambotti/cartodb_leaflet) but with my own PostGIS. The scope is to mimic what ESRI has been done with ArcGIS Server (http://developers.arcgis.com/javascript/samples/query_bypoly/) and its geoprocessing capability.
Basically a user can click on map to select a zipcode that intersects the map click and all zipcode that touch selected one; in other worlds getting all the adjacent zips. So, I am not there yet but very close. Happy coding for now...and soon I hope to make it live.
Cheers...
Thursday, October 30, 2014
Node JS + Express + PostGIS + Leaflet
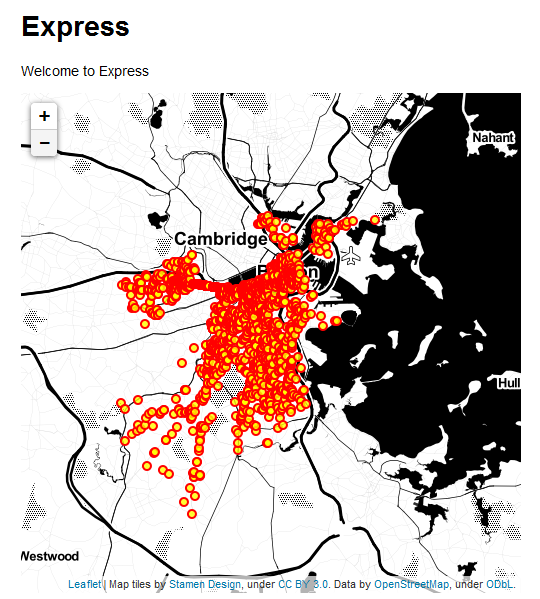 After following an interesting workshop about mapping with Node JS, PostGIS and Leaflet I have got pretty excited, and so I have decided to spend some time with it. I have basically followed this tutorial (http://boomphisto.blogspot.com/2011/07/nodejs-express-leaflet-postgis-awesome.html) and after some issues I created my first map (bikes accident in Boston). Very important put your code before use the routes as suggested here (http://cwbuecheler.com/web/tutorials/2013/node-express-mongo/)
Tuesday, June 10, 2014
Extract an ArcGIS Server Services to a shapefile/feature class
- On the server side you have to use the query capability and retrieve all features in a JSON format. Try it using this link: http://www.geoportal.cl/ArcGIS/rest/services/MinisteriodeViviendayUrbanismo/chile_minvu_ddu_pri_Costero_Ohiggns/MapServer/0/query?text=&geometry=&geometryType=esriGeometryPolygon&inSR=&spatialRel=esriSpatialRelIntersects&relationParam=&objectIds=&where=OBJECTID++%3E+0&time=&returnCountOnly=false&returnIdsOnly=false&returnGeometry=true&maxAllowableOffset=&outSR=&outFields=&f=html As you can see from the form page to get all the features, I set the WHERE field to be OBJECTID > 0, and the Geometry Type to be a Polygon, the Return Field to * (so that I can get all attributes), and the format to be JSON file; then you can click the query button.
- Save out the JSON file you get on your browser, just right click on the browser and choose Save Page As
- Use the tool in ArcMap JSON to Features (http://resources.arcgis.com/en/help/main/10.2/index.html#//001200000057000000)
- Convert the feature class into a shapefile
Tuesday, February 4, 2014
Python and edX
Last semester I have took "Introduction to Computer Science and Programming" at edX (https://www.edx.org/course/mitx/mitx-6-00-1x-introduction-computer-1498). A lot work but I have learned a lot about python.

Friday, January 25, 2013
Friday, October 19, 2012
FC to CSV keeping the Alias Name
This is my Python way to export a Feature Class attributes table into a CSV file, and keep the ALIAS NAME.
Friday, June 22, 2012

Thursday, June 14, 2012
GeoPY and CSV file
Ok, yesterday evening and a bit today, I have updated my previous attempt to geocode a cvs table using GeoPy(http://code.google.com/p/geopy/). Here the code that I have wrote; it's not perfect but works. Next step will be adjust the output, and test it against a serious data-set.
Wednesday, March 21, 2012
Tuesday, September 20, 2011
Great app that involved Google Map API V3, Fusion Table and Google Visualization
http://cga-3.hmdc.harvard.edu/cluster/industry/

http://cga-3.hmdc.harvard.edu/cluster/industry/

Friday, September 9, 2011
Export to CAD from a DEM (ArcGIS/ArcInfo 10)
Export to CAD from a DEM (ArcGIS/ArcInfo 10)
1) Download the DEM and import it in ArcGIS
2) Convert the DEM to a contour file (isolines)
ArcToolBox >> Spatial Analysit >> Surface >> Contour
3) Create a 3D contour line
ArcToolBox >> 3D Analyst Tools >> 3D Features >> Feature To 3D By Attribute
4) Create a CAD .dwg file
ArcToolBox >> Conversion Tools >> To CAD >> Export to CAD
1) Download the DEM and import it in ArcGIS
2) Convert the DEM to a contour file (isolines)
ArcToolBox >> Spatial Analysit >> Surface >> Contour
3) Create a 3D contour line
ArcToolBox >> 3D Analyst Tools >> 3D Features >> Feature To 3D By Attribute
4) Create a CAD .dwg file
ArcToolBox >> Conversion Tools >> To CAD >> Export to CAD
Wednesday, May 25, 2011
Monday, May 2, 2011
Sunday, November 7, 2010
Open Street Map Party at MIT

Hi there,
today I was at the OSM party at MIT (http://osmbos1.eventbrite.com/). It was pretty nice starting to edit OSM database,
and knowing better about this awesome project. I started to map features on my own
little mountain village, very fun seeing how the map change in few minutes....
Wednesday, October 6, 2010
Perform Cost Path Analysis between two points
 Today I help a student to deal with Cost Path Analysis between two points. Below some tips:
- Identify your study area (polygon layer) and use this one to cut your DEM by using Extraction by Mask function. Be sure you are working in a project coordinate system (slope requires it).
- Use the new DEM to calculate the slope raster (Slope function)
- Select only one of the two point (Point A)
- Perform a Cost Distance; as input raster enter the point layer. Make sure you build also a Back Link raster.
- Select the only the second point (Point B)
- Perform a Cost Path; as input raster enter the point layer.
Tuesday, October 5, 2010
XML, XPath, XQuery Harvard Class
Just forgot to tell you that since the begging of September, I have started a Xml/XPath class
at Harvard Extension School. The class is pretty tough, but so far I really enjoy my self.
By the way, I have also stared to use Amazon EC2
at Harvard Extension School. The class is pretty tough, but so far I really enjoy my self.
By the way, I have also stared to use Amazon EC2
Subscribe to:
Posts (Atom)